In the early days of satellite Earth observations, the University of Maryland worked together with NASA and USDA to develop the first web-based platform to enable near-real-time monitoring of global croplands, enabling users across the globe to track crop conditions as growing seasons unfolded (re. Monitoring Global Croplands with Coarse Resolution Earth Observations: The Global Agriculture Monitoring (GLAM) Project). After years of operational use and a lot of valuable feedback from partners, the time came to redesign this system – known as Global Agricultural Monitoring or GLAM – to be faster, more flexible, and to capitalize new datasets coming online and new computing architectures available. The updated GLAM system has been maticulously developed by the UMD-based NASA Harvest team made up of the Department of Geographical Science's Dr. Alyssa Whitcraft, John Keniston, Dr. Michael Humber, Antonio Sanchez, and Blake Munshell.

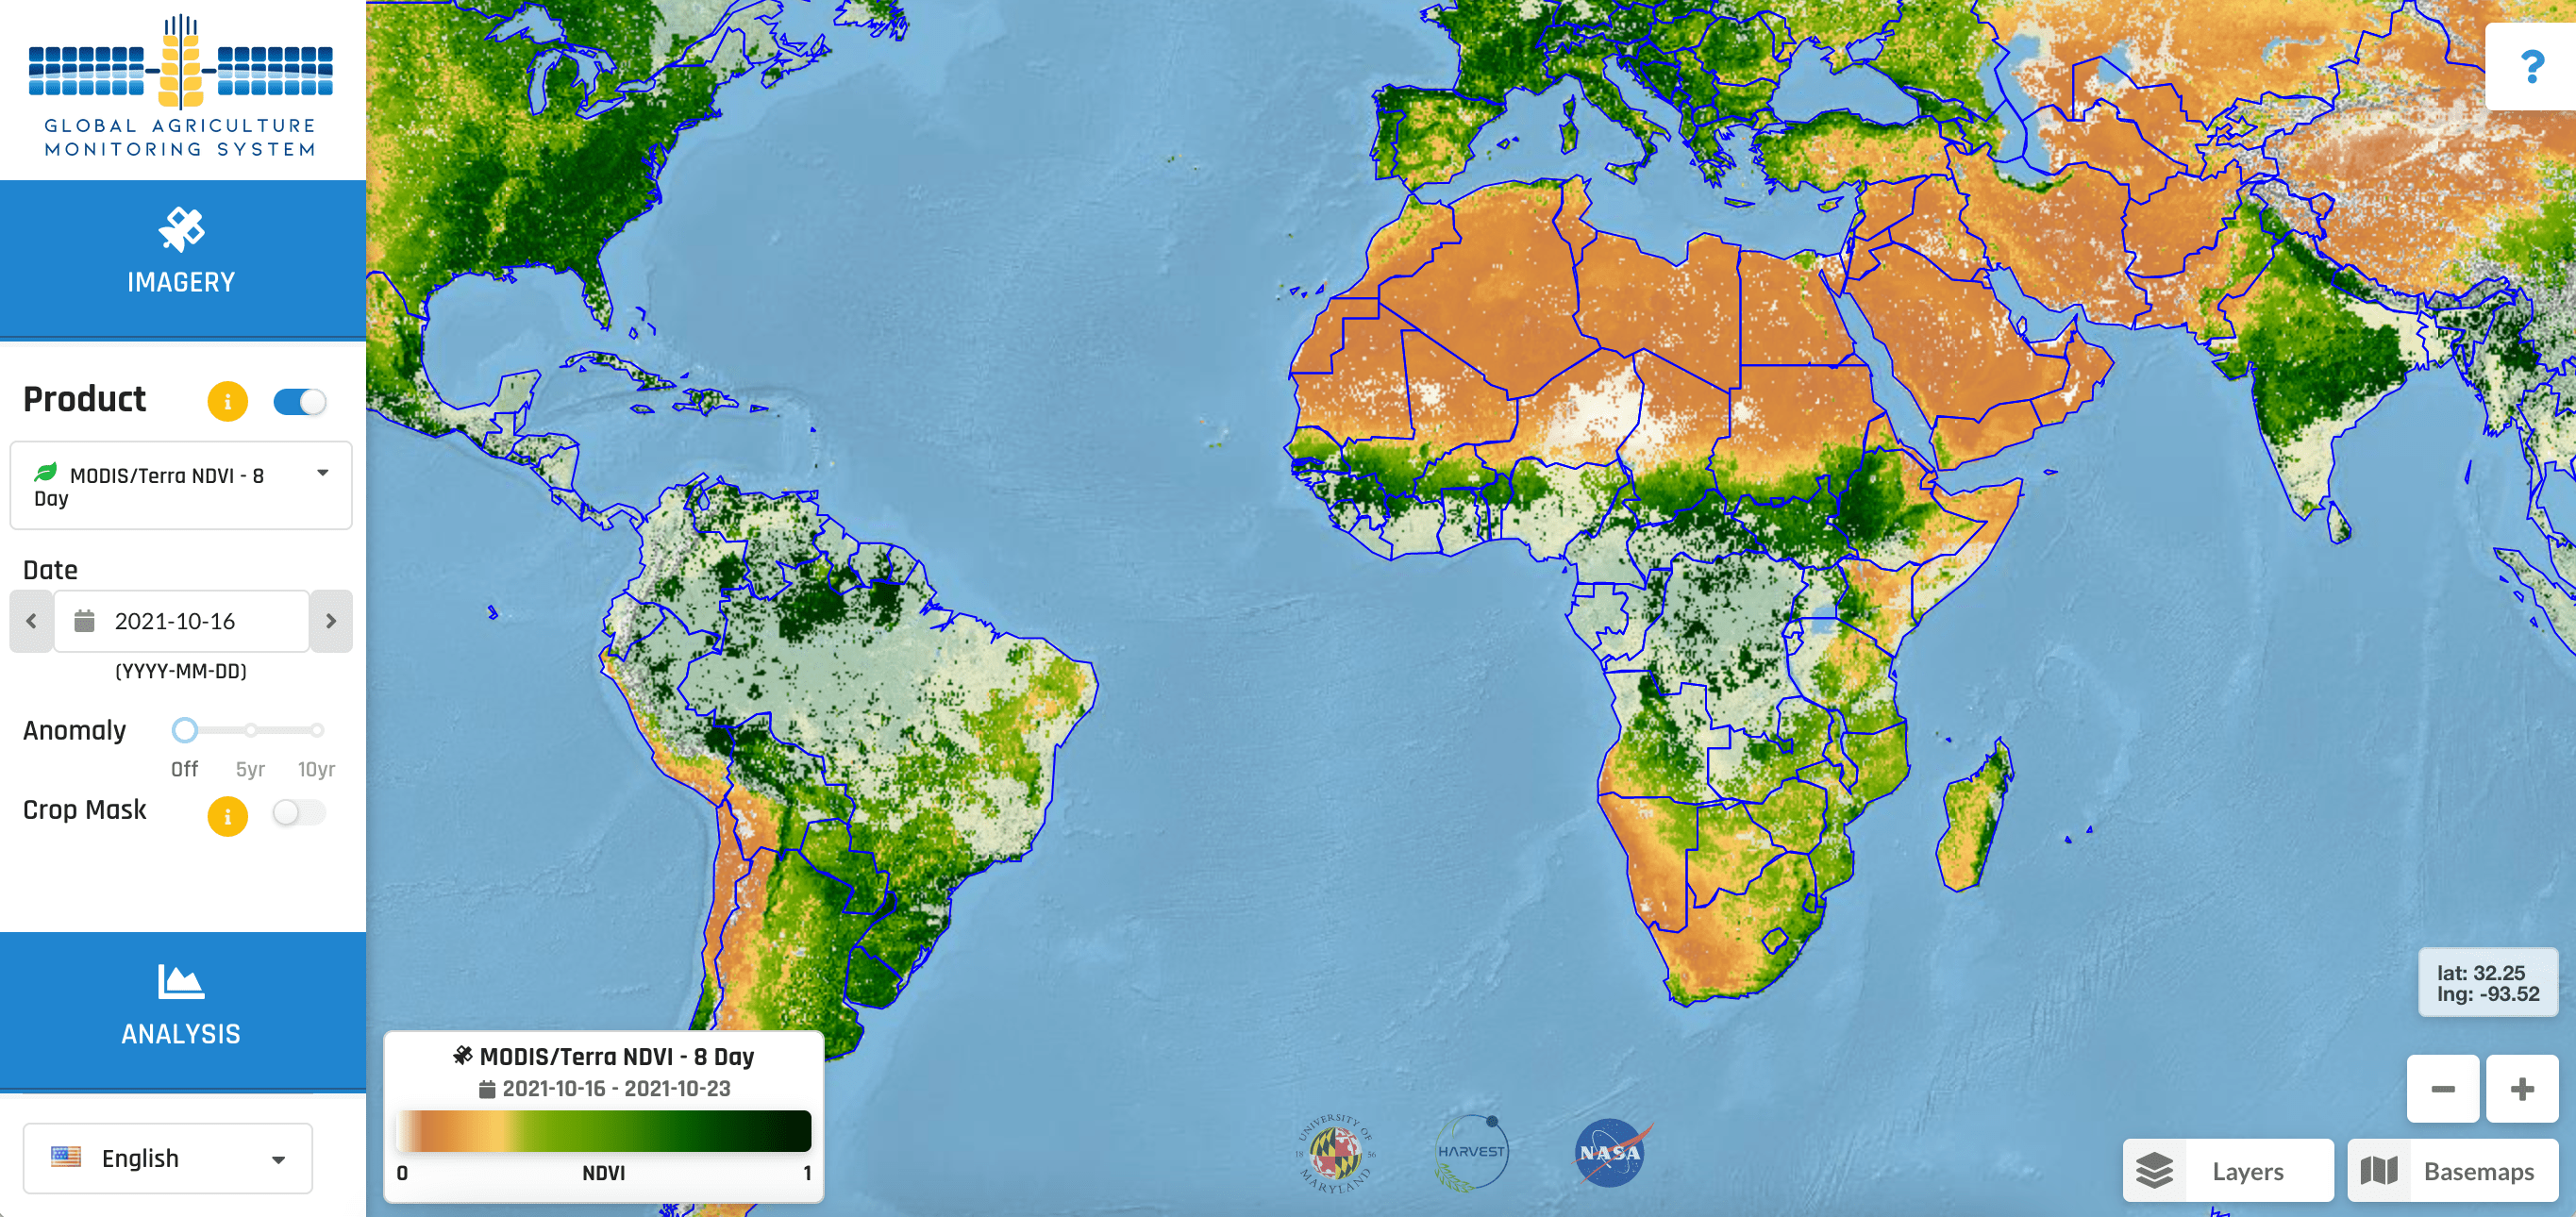
The new GLAM interface features and updated design and modernized functionality.
New GLAM System Features, Datasets, and Functionalities
Now lightning-fast due to back-end developments that drastically reduce processing time, the new GLAM system includes many new functions. Users can access the publicly-available web-interface from anywhere in the world, as all processing takes place on “the cloud” and does not rely on local bandwidth to compile datasets. They can use the interface to pan around the globe to a region of interest. They can select an administrative boundary or draw a custom polygon to investigate. They can select from a variety of cropland and crop type masks to target relevant croplands, and then create custom time series charts with the ability to calculate mean and anomaly for datasets over time. Because cloud cover is a common issue in many agricultural regions and cultivation periods, users can customize their cloud cover tolerance in plotting and displaying imagery as well. Furthermore, users also have the ability to overplot crop calendar information on their time series plots, which provides important context to compare crop conditions between years.
In addition to these new functions and features, the interface includes multiple new datasets to help analysts glean insight into the drivers behind anomalous crop conditions throughout the world. Currently, the new GLAM system includes 8-day and 16-day NDVI datasets from NASA’s Moderate Resolution Imaging Spectroradiometer (MODIS), CHIRPS Precipitation datasets from the University of California Santa Barbara Climate Hazards Center, Soil Water Index from the Copernicus Global Land Service, and Temperature datasets from NASA’s MERRA-2 product, with more datasets on the way. In addition to these additional datasets and improvements made to the system architecture, the new GLAM system boasts a modern web map design, utilizing a variety of code frameworks and libraries including Django, Leaflet, and HighCharts.
See the full article on NASA's Earth Observatory website "Agricultural Monitoring Gets GLAMorized" and visit https://glam.nasaharvest.org/ to explore the tool.
